 pool ads
How to Develop Trading Plans for Trinity Industries TRN and other Stocks
According to Stock Traders Daily, a 20-year industry veteran, #investors can use the #priceaction in Trinity Industries (NYSE: TRN) to foretell upcoming changes. A current example is provided below. There are trading plans for TRN, but the data on this page does not update in real time. If you want a real time update, or a different stock, please get one here Unlimited Real Time Reports.
Technical Summary
| Term → | Near | Mid | Long |
|---|---|---|---|
| Rating | Strong | Weak | Strong |
| P1 | 0 | 0 | 27.51 |
| P2 | 28.15 | 27.86 | 30.57 |
| P3 | 28.49 | 28.70 | 33.92 |
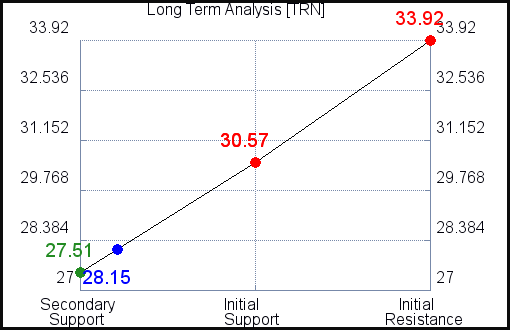
Support and Resistance Plot Chart for TRN
Longer Term Trading Plans for TRN
TRN - (Long) Support Plan
Buy over 27.51 target 30.57 stop loss @ 27.43
TRN - (Short) Resistance Plan
Short under 30.57, target 27.51, stop loss @ 30.66

Blue = Current Price
Red= Resistance
Green = Support
Real Time Updates for Repeat Institutional Readers:
Factset: Request User/Pass
Bloomberg, Reuters, Refinitiv, Zacks, or IB users: Access Here.
Our Market Crash Leading Indicator is Evitar Corte.
Evitar Corte warned of market crash risk four times since 2000.
It identified the Internet Debacle before it happened.
It identified the Credit Crisis before it happened.
It identified the Corona Crash too.
See what Evitar Corte is Saying Now.
Get Notified When our Ratings Change: Take a Trial